What does the data say about DuSable Lake Shore Drive?
We ran a community visioning survey. Here’s what we found…
Our key take aways
Residents’ top priorities
Across the board, residents’ top priorities are:
Improved pedestrian and bike access to the lakefront and parks.
Expanded pedestrian and bike access to lakefront and downtown neighborhoods.
Preserving and expanding greenspace and natural areas.
When asked what their priority outcomes for a lakefront and DLSD redesign, respondents ranked these items as their top priorities–across the board. This includes when the data was broken down by the geography (all respondents, North Side residents, South Side residents, outer neighborhood residents, and suburban residents*).
Increasing transit access
Reducing the number of people that need to drive and increasing transit access to lakefront and downtown neighborhoods are other key priorities. Over 60% of respondents across all geographic breakdowns ranked selected both these options as priorities.
Other popular transportation priorities include increasing transit connections between the North and South Side (over 50% of respondents selected this priority with South Side residents reporting the highest rate of support at 60%).
The environment
The environment is a major concern for all residents; reducing vehicle pollution of all kinds (greenhouse gas emissions, noise pollution) was a priority for residents region-wide.
Across geographies, 60% or more of respondents selected both reducing noise pollution from vehicles and reducing GHG emissions from vehicles as a priority outcome (except suburban residents who ranked reducing noise pollution as a slightly lower priority with 56% of respondents selecting it).
Back to Top
NOTE: All data was analyzed by Total Responses and by geography. The following geographies were assessed as part the analysis: North Side (residency), South Side (residency), Outer Neighborhoods including Northwest, West, Southwest Sides (residency), Suburban Chicago excluding Indiana, Wisconsin, and Evanston (residency). Other geographies considered, but not for all data analysis include Evanston and the Central Area (Chicago).
DLSD’s Perceived Impact on the Lakefront
73% said DLSD diminishes the quality of the parks.
73% said DLSD diminishes the quality of the parks.
This holds across geographies with the highest level of dissatisfaction coming from Central Area (Chicago) residents, of which 78% stating DLSD diminished the quality of the parks.
74% of Outer Neighborhood residents reported they felt DLSD diminished lakefront access – higher than both North and South Side residents who live closer to the lake, although both groups reported high levels of dissatisfaction with DLSD’s impact on lake access (74% and 68% respectively [the latter is also the lowest reported level of dissatisfaction re: DLSD’s impact on lakefront access]).
Back to Top
People’s Transportation Habits
52% reported having one car.
34% reported having zero cars.
Amongst those reporting they had access to one or more cars in their household, 51% reported that they “own a car, but don’t want to own a car.” Among those who already don’t own, 93% reported they were satisfied with this arrangement, stating no desire to own a car.
Across geographies, 45%-55% of respondents reported wanting to give up their car (this may include people wanting no car whatsoever, or wanting to give up one or more cars in their household).
Outer Neighborhood and Suburban residents reported the strongest desire to give up one or more cars in their household at a rate of 58% and 54% of reported car owners respectively.
70% want to drive less than they currently do
A significant gap exists between people’s reported real-life transportation mode split and people’s desired transportation mode-split.
There is a strong desire to live car-lite or car-free in Chicago.
Outer Neighborhood and Suburban drivers reported wanting to drive less than they currently do the highest rates, 83% and 72% respectively.
The second biggest gap between real and desired transportation mode split is ride hail, with over two-thirds of respondents reporting they wanted to order rides less frequently than they currently must.
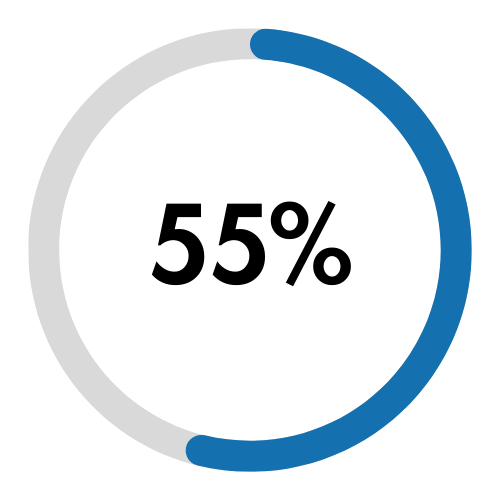
55% reported they want to bike more than they currently do
There is huge untapped demand to bike! This includes personal bakes and Divvy/bike share.
The strongest desire to bike more was reported by South Side residents, where 96% of residents expressed a desire to bike more as part of their transportation mode mix. 100% of suburban respondents reported wanting to bike more than they currently do as part of their transportation mode mix.
Despite the large rate of biking on the North Side, biking was the second most desirable transportation preference reported when compared to current transportation mode mix. Over 55% of North Side residents expressed a desire to bike more than they currently do.
Most people want to take transit, but many can’t reliably do so for most trips.
More people would like to take transit on a regular basis currently than would like to. However, there is a greater degree of variability between which transit services residents would like to use more based on their geography.
Overall, there 36.8% difference between the number of people currently using Metra versus those would like to use it more. There was a 9.2% increase in the number of people who currently use the CTA ‘L’ trains compared with current usage.
The greatest gap between current CTA ‘L’ use and preferred is among the following populations: Suburban residents (48% gap from current and preferred use), Outer Neighborhood residents (24.2% preference gap), and South Side residents (20.6% preference gap).
There is a strong desire to use Metra more among North Side (63.7% preference gap) and Outer Neighborhood residents (55.5% preference gap), areas with less service and hobbled by bad intermodal connections.
Notably, fewer South Side and Suburban residents wanted to take Metra; the same trend is seen among North Side residents and L use. This likely reflects the strong level of service provided in the respective geographes.


